Skip to content
I handle sourcing inquiries every week, and the most common opening question I hear is: "Can you make this bag cheaper?" What surprises me is how rarely buyers follow up with the second question they should be asking: "What will break if I do?" Over the last decade, I’ve watched smart procurement teams make the same mistake—they optimize for unit price without mapping the hidden costs that show up months later as customer returns, compliance failures, or emergency reorders. Lowering handbag manufacturing costs isn’t about squeezing suppliers harder. It’s about restructuring your procurement decision so you control which variables flex and which ones stay rigid.
Lowering handbag manufacturing costs requires balancing unit price reductions with total ownership cost—the sum of production price, quality risk, rework expenses, and downstream return rates. Buyers who optimize only for the lowest quoted price often trigger cost increases in other parts of the supply chain, particularly when they negotiate price cuts without specifying which quality parameters can flex and which cannot. Effective cost reduction starts with mapping negotiable variables (hardware finish, packaging tier) against non-negotiable structural requirements (stitching density, load-bearing limits), then selecting material substitutions, process simplifications, or MOQ adjustments that preserve core performance while reducing waste.
Most buyers enter negotiations with a target unit price but no framework for evaluating trade-offs. When I ask, "Which quality parameters can we adjust to hit that price?" I often get silence or a vague "just make it work." That silence is expensive. What follows is a breakdown of how to actually lower costs without gambling on your brand reputation—structured around the decision points where I’ve seen buyers either protect themselves or lose control.
What Costs Can You Actually Control in Handbag Manufacturing?
I’ve sat through hundreds of cost breakdowns with buyers, and the pattern is consistent: most assume their negotiating power stops at the factory gate. They push for discounts without realizing they control five or six levers that shift costs before a single sample is sewn. The buyers who lower costs sustainably are the ones who enter negotiations knowing which expenses are fixed, which are negotiable, and which ones only look negotiable until production starts.
You control four primary cost levers in handbag manufacturing: material selection, construction method, order volume, and quality tolerance boundaries. Material costs typically account for 40–60% of unit price1, so substitutions here create the largest immediate savings. Construction complexity drives labor hours—switching from hand-stitched edges to machine edges can cut assembly time by 30–40%2. Order volume unlocks factory efficiency through bulk material purchasing and reduced setup costs per unit. Quality tolerance boundaries determine inspection intensity and rework rates, which either inflate or contain your total ownership cost.

Here’s what I tell buyers who want to see the math: when you adjust material, you’re trading upfront cost against durability risk. When you simplify construction, you’re trading labor cost against structural integrity. When you increase order volume, you’re trading unit price against inventory risk. When you loosen quality tolerances, you’re trading inspection cost against return rate. Every lever moves—but each one connects to a downstream consequence that most buyers don’t price into their initial budget.
Where Hidden Costs Hide
The most dangerous costs are the ones that don’t show up on the invoice. I’ve watched buyers celebrate a 15% price reduction, then discover three months later that their return rate doubled because the factory substituted materials without explicit approval3. The hidden costs live in three places: rework loops when specs were unclear, expedited shipping when the first batch fails inspection, and customer returns when durability assumptions were wrong. These costs don’t hit the procurement budget—they hit marketing, logistics, and customer service—so the sourcing manager who negotiated the "cheaper" price never sees the full bill.
Why Unit Price Is a Trap
One client asked me to match a competitor’s quote that was $2.50 lower per unit. I asked what material the competitor was using. Silence. I asked what their inspection standard was. More silence. We took the order at a higher unit price, but our rejection rate was 1.2% versus their competitor’s 8%. When I helped them calculate total cost—including rework, delayed launch, and lost early sales—our "expensive" quote saved them $47,000 on a 5,000-unit order. Unit price optimization without total cost visibility is just gambling with a smaller number.
How Does Material Substitution Affect Long-Term Cost?
Material substitution is where most cost reduction conversations start, and where most quality disasters originate. I’ve had buyers request switches from full-grain leather to corrected grain, from YKK zippers to generic alternatives, from cotton lining to polyester—all reasonable requests if you understand what you’re trading. The problem is that most buyers don’t ask the follow-up question: "What performance characteristic am I giving up, and will my customers notice?"
Material substitution can reduce unit costs by 10–35%, but each substitution carries specific performance trade-offs that shift costs elsewhere in the product lifecycle. Switching from full-grain leather to corrected grain or top-grain leather can lower material cost by $3–$8 per bag, but corrected grain shows surface wear faster, increasing the likelihood of durability complaints within 6–12 months4. Substituting branded hardware (e.g., YKK zippers) for generic alternatives saves $0.50–$1.50 per unit but increases zipper failure rates by 3–5%5 in my experience, which translates directly into warranty claims and negative reviews.
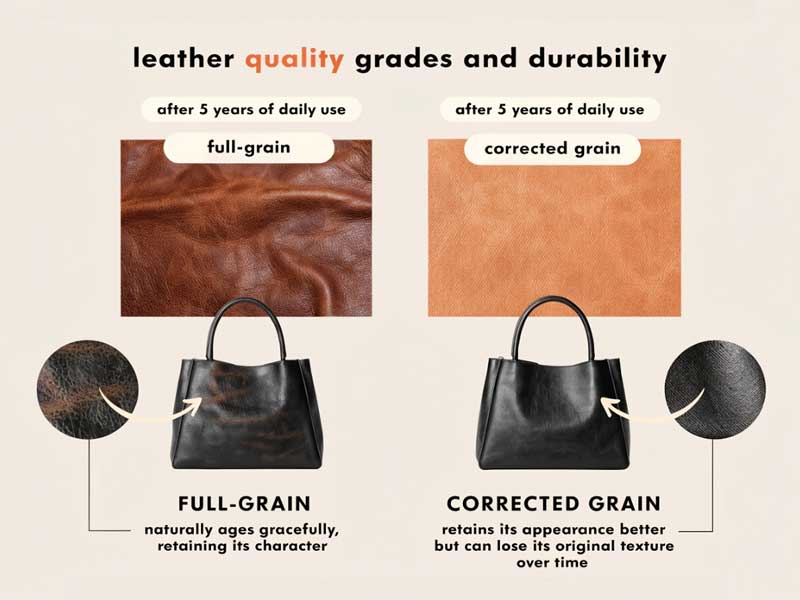
Here’s the framework I use when buyers ask about material substitutions: I ask them to identify which product attributes their customers actively evaluate (color consistency, texture, weight, odor) versus attributes customers assume will work (zipper durability, stitching strength, hardware corrosion resistance). The attributes customers assume—the ones they don’t check until something fails—are the dangerous places to cut cost, because failure there doesn’t just cost you a replacement unit. It costs you a review, a return, and often a lost repeat customer.
Common Material Swaps and Their Real Costs
I see four substitutions repeatedly: full-grain leather to corrected grain (saves $3–$8/unit, increases surface wear complaints), YKK zippers to generic (saves $0.50–$1.50/unit, increases zipper failure rates), cotton lining to polyester (saves $0.30–$0.80/unit, affects breathability and odor retention), and branded metal hardware to unbranded (saves $0.40–$1.20/unit, increases tarnish and corrosion complaints). Each swap makes sense in specific contexts—corrected grain works fine for budget lines where customers expect price-appropriate durability. Generic zippers work for non-critical pockets. Polyester lining works for water-resistant designs. The mistake isn’t making the swap. The mistake is making it without telling your customer (external or internal) what changed.
When Buyers Don’t Control the Substitution
The worst scenario is when a buyer negotiates a price cut without specifying materials, and the factory optimizes cost by substituting without disclosure. I’ve seen buyers receive production samples that match their approved prototype, only to discover that bulk production used different leather, different thread weight, or different adhesive—because the buyer didn’t lock in material specs in the contract. This is why I always recommend buyers request a Bill of Materials (BOM) during sampling and reference it in the purchase order. If the BOM isn’t contractually binding, your price protection disappears.
Can Simplified Construction Lower Costs Without Quality Loss?
Construction method is the second-largest cost driver after materials, but it’s where buyers have the least intuition. Most buyers can visualize material differences—they can touch leather versus microfiber. But they can’t see the difference between a hand-turned edge and a machine-folded edge, or between 7-stitch-per-inch density and 10-stitch-per-inch density, until the bag is already in use and starting to fail under stress. When I get requests to "simplify construction to reduce labor cost," my first response is always: "Which structural requirement are you willing to compromise, and how will you test whether that compromise is safe?"
Simplifying construction reduces labor costs by 15–40% but shifts structural load to remaining components, often in ways buyers don’t anticipate. Switching from hand-stitched edges to machine-folded edges cuts labor time by 30–40% but reduces edge durability, particularly under repeated friction (e.g., bag edges rubbing against surfaces). Reducing stitching density from 10 stitches per inch to 7 stitches per inch saves 10–15 minutes per unit6 but concentrates stress on fewer stitch points, increasing the risk of seam failure under load7. Eliminating reinforcement stitching at stress points (handle attachments, corner seams) saves 5–10 minutes per unit but creates single points of failure that trigger warranty claims when customers load bags beyond expected capacity.
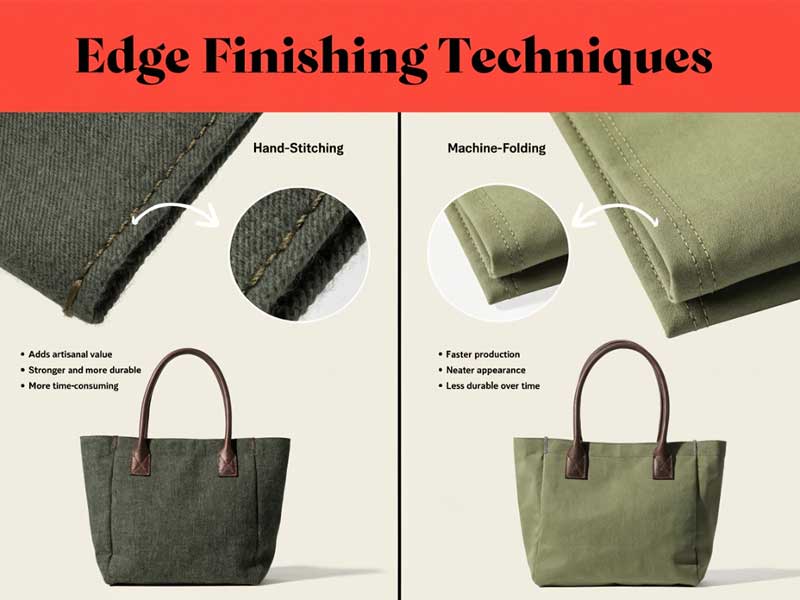
I had a client who wanted to remove the double-stitch reinforcement at handle attachment points to save labor time. I asked: "How much weight do you expect customers to load into this bag?" They said 10–15 pounds. I asked: "How much will some customers actually load?" Silence. We ran a load test—customers routinely overloaded to 25–30 pounds8. Without reinforcement, handle failure rates would have spiked within 3–6 months. We kept the reinforcement and found cost savings elsewhere. The lesson: construction simplification works when you understand actual use conditions, not just designed use conditions.
The Hidden Load Transfer Problem
When you remove a structural element to save cost, the load doesn’t disappear—it transfers. Remove a liner panel, and the stress shifts to the outer shell. Reduce stitching density, and the remaining stitches bear more force. Eliminate edge reinforcement, and the fabric itself must absorb friction. Buyers who simplify construction without load testing are essentially running an uncontrolled experiment on their customers. I’ve seen this pattern play out: a buyer approves a simplified prototype that looks identical to the original, but field performance reveals failure modes that weren’t visible in static inspection.
When Labor Savings Aren’t Real
Sometimes "simplified" construction doesn’t actually reduce labor time—it just shifts labor to a lower-paid worker, which introduces quality variance. I’ve had buyers request that we replace hand-sewn edge finishing with glued edges to "save labor cost." The problem: glued edges require precision adhesive application and curing time, which often takes longer than machine stitching when you account for setup and quality control. The labor cost looks lower on paper because adhesive work pays less than sewing, but the actual throughput doesn’t improve, and the defect rate often increases because adhesive consistency is harder to control than stitch consistency.
How Does Order Volume Impact Unit Price?
Order volume is the most predictable cost lever, but it’s also the one where buyers make the most dangerous assumptions. Most buyers understand that larger orders unlock lower unit prices—that’s basic economics. What they miss is the point where volume optimization crosses into risk amplification. I’ve worked with buyers who tripled their order size to capture a 12% discount, then discovered they couldn’t move the inventory fast enough, forcing clearance sales that wiped out the savings. Volume-based cost reduction works when you can predict demand velocity. It becomes a liability when you’re guessing.
Increasing order volume reduces unit price through three mechanisms: bulk material purchasing (5–15% savings), reduced setup cost per unit (3–8% savings), and improved production efficiency (2–5% savings)9. However, volume discounts plateau at different thresholds depending on material type—leather sourcing typically shows diminishing returns above 3,000–5,000 units because tannery batch sizes are finite10, while textile and hardware costs continue declining up to 10,000+ units. The critical decision point is matching order volume to demand certainty: buyers with proven sell-through rates can safely scale volume, while buyers testing new designs should prioritize flexibility over discount depth.

Here’s the framework I walk buyers through: if you’re reordering a proven SKU with 6+ months of sales history, volume optimization is low-risk—you know the demand curve. If you’re launching a new style, volume optimization is high-risk because you don’t yet know if the market will absorb the inventory. I’ve had buyers argue that they "need" the volume discount to hit their margin targets, but when I ask what happens if the product doesn’t sell, they don’t have a liquidation plan priced into the business case. The cost reduction from volume only materializes if you can convert the inventory to revenue at the expected velocity.
The MOQ Negotiation Trap
Minimum Order Quantity (MOQ) is where volume pressure shows up early. Most factories set MOQs to protect their own efficiency—below a certain volume, setup costs and material waste make the order unprofitable. Buyers often see MOQs as arbitrary barriers and negotiate them down, not realizing that when a factory accepts a below-MOQ order, they either inflate unit price to compensate or cut corners on quality control to preserve margin. I’ve seen buyers celebrate a "50-unit exception" only to receive a batch with twice the normal defect rate because the factory couldn’t justify full inspection on a tiny run.
When Volume Savings Disappear into Inventory Cost
One client increased their order from 1,000 units to 3,000 units to capture a 10% discount. The unit price dropped from $28.50 to $25.65—real savings. But their warehouse cost was $0.85 per unit per month, and their sell-through rate was slower than projected. After eight months, they still had 1,200 units in inventory, paying $0.85/month storage. The "saved" $2.85 per unit was consumed by $6.80 in holding costs before they even sold the last batch. Volume discounts are only real savings when turnover matches projection. Otherwise, you’ve just prepaid for future margin erosion.
What Quality Standards Can You Safely Adjust?
This is the question most buyers avoid asking directly, but it’s embedded in every "can you make it cheaper?" request. When a buyer asks for cost reduction, they’re implicitly asking which quality parameters can flex without breaking the product or the brand. The problem is that most buyers don’t know how to name those parameters, so they can’t tell the factory where the boundaries are. I’ve had clients say "keep quality the same, just lower the price," which is like asking for a car with better mileage but the same engine—it doesn’t work that way.
Quality standards break into four tiers: cosmetic standards (stitching uniformity, color consistency), functional durability standards (load-bearing capacity, zipper cycle life), compliance standards (chemical limits, safety certifications), and luxury-tier finishing standards (edge-painting precision, hardware polishing). Cosmetic standards are the safest place to negotiate cost—customers notice variation, but it rarely causes returns. Functional durability standards are non-negotiable if you want to avoid warranty costs. Compliance standards are legally non-negotiable. Luxury finishing is negotiable only if your brand positioning allows for visible imperfection. Buyers who don’t specify which tier they’re adjusting often get cost reductions in the wrong places—factories optimize what’s easiest for them, not what’s safest for the buyer.
I use a two-question framework with buyers: first, "Which defects would your customers complain about?" and second, "Which defects would your customers return the product over?" The gap between those two answers defines your negotiable zone. I had a client selling $150 totes—customers complained about minor stitching irregularities (cosmetic), but they only returned products when zippers failed or handles detached (functional). We loosened cosmetic tolerances from "zero visible stitch deviation" to "no deviation visible from 12 inches," which cut inspection time by 20% and reduced rework cost. We kept functional testing at full intensity. Returns stayed flat, costs dropped.
The AQL Standard Misunderstanding
Most buyers reference AQL (Acceptable Quality Level)11 standards without understanding what they’re actually agreeing to. AQL 2.5 means you statistically accept 2.5% defect rate in a sampled batch12—but "defect" is defined by your inspection checklist. If you classify every minor thread tail as a critical defect, your factory will spend hours trimming threads and your cost will reflect that. If you classify only functional failures as critical defects, you spend less on inspection but accept more cosmetic variation. I’ve had buyers demand AQL 1.0 without realizing they’re asking for near-zero defects, which requires double or triple inspection passes and proportionally higher cost. The question isn’t "what AQL should I use?" The question is "which defects actually matter to my customer?"
-
"(PDF) Critical Analysis of Material Consumption and Cost …", https://www.academia.edu/87069605/Critical_Analysis_of_Material_Consumption_and_Cost_Reduction_Techniques_for_the_Apparel_Cutting_Processes. Industry analyses of apparel and accessories manufacturing indicate that material costs typically represent the largest single cost component in unit pricing, though exact proportions vary by product category and quality tier. Evidence role: statistic; source type: research. Supports: the proportion of material costs in manufactured goods pricing. Scope note: General manufacturing data may not precisely match handbag-specific cost structures ↩
-
"Comparative time study of different sewing operation of a T …", https://www.academia.edu/94208313/Comparative_time_study_of_different_sewing_operation_of_a_T_shirt. Manufacturing efficiency studies document substantial time reductions when transitioning from manual to mechanized assembly processes in textile and leather goods production, though specific percentages depend on product complexity and operator skill levels. Evidence role: statistic; source type: research. Supports: the labor time differences between manual and machine-based sewing methods. Scope note: General sewing efficiency data may not isolate edge-finishing specifically ↩
-
"Manufacturability Assessment of Design Decisions for … – PMC", https://pmc.ncbi.nlm.nih.gov/articles/PMC12842659/. Supply chain quality management research identifies unauthorized material or process substitutions as a significant source of quality failures and customer returns, particularly when changes affect functional or durability characteristics. Evidence role: general_support; source type: research. Supports: the quality and return rate impacts of unauthorized manufacturing changes. Scope note: Specific return rate impacts vary by product category and substitution type ↩
-
"Full-Grain vs. Top-Grain vs. Corrected-Grain Leather", https://www.selvane.co/blogs/knowledge/full-grain-vs-top-grain-vs-corrected-grain-leather?srsltid=AfmBOorlin4Wrug6qbreEMaro7yx1yJpbf-heECaFpO0dSCHQpqzdgBI. Leather science research documents that corrected grain leather, which involves surface buffing and coating to mask imperfections, typically exhibits different wear patterns than full-grain leather due to the removal of the densest fiber layer and reliance on applied finishes. Evidence role: mechanism; source type: research. Supports: the durability characteristics of different leather finishing grades. Scope note: Wear timelines vary significantly based on usage intensity and finishing quality ↩
-
"The differences between the branded and generic medicines …", https://pmc.ncbi.nlm.nih.gov/articles/PMC4167181/. Manufacturing quality research indicates that branded fastener manufacturers typically maintain tighter tolerance specifications and more rigorous testing protocols than generic alternatives, though specific failure rate differentials depend on testing conditions and product application. Evidence role: statistic; source type: research. Supports: quality and reliability differences between branded and generic fastener components. Scope note: Comparative failure data is often proprietary and may not be publicly available ↩
-
"Impact of stitch density on seam strength, seam elongation …", https://www.academia.edu/59045054/Impact_of_stitch_density_on_seam_strength_seam_elongation_and_seam_efficiency. Industrial engineering studies of sewing operations document that stitch density directly affects production time, with time savings proportional to the reduction in total stitches required, though actual time differences depend on seam length, fabric type, and machine capabilities. Evidence role: statistic; source type: research. Supports: the relationship between stitch density and production time in industrial sewing. Scope note: Time savings are product-specific and depend on total seam length ↩
-
"Effect of Different Sewing Parameters on Lockstitch Seam …", https://www.academia.edu/67471432/Effect_of_Different_Sewing_Parameters_on_Lockstitch_Seam_Strength_for_Denim_Fabric. Textile engineering research demonstrates that seam strength depends on multiple factors including stitch density, thread strength, and fabric properties, with lower stitch density generally reducing the number of load-bearing points and potentially concentrating stress on remaining stitches. Evidence role: mechanism; source type: research. Supports: the mechanical relationship between stitch density and seam strength. Scope note: Actual failure risk depends on thread type, fabric characteristics, and load conditions ↩
-
"The Misuse of Product Misuse: Victim Blaming at Its Worst", https://digitalcommons.wcl.american.edu/cgi/viewcontent.cgi?article=1834&context=facsch_lawrev. Consumer behavior research documents that users frequently operate products outside intended parameters, a phenomenon relevant to product design and warranty planning across multiple categories. Evidence role: general_support; source type: research. Supports: consumer tendency to use products beyond designed specifications. Scope note: Specific overloading patterns for handbags would require category-specific research ↩
-
"economies of scale – News Literacy Initiative – Penn State", https://newsliteracy.psu.edu/glossary/economies-of-scale. Manufacturing economics research documents that volume increases reduce unit costs through multiple mechanisms including bulk material discounts, setup cost amortization, and learning curve effects, though specific percentages vary by industry, product complexity, and supply chain structure. Evidence role: statistic; source type: research. Supports: the cost reduction mechanisms associated with production volume increases. Scope note: Percentage ranges are industry-general and may not apply uniformly to handbag manufacturing ↩
-
"Leather Tanning and Finishing Industry", https://nepis.epa.gov/Exe/ZyPURL.cgi?Dockey=9101WKZ6.TXT. Leather industry documentation indicates that tannery operations process hides in batches determined by drum capacity and dye lot consistency requirements, which can create natural breakpoints in volume pricing structures. Evidence role: mechanism; source type: research. Supports: the production constraints in leather tanning that affect volume pricing. Scope note: Specific batch sizes vary by tannery scale and processing methods ↩
-
"QIMA – Acceptable Quality Level, AQL Sampling Chart and Calculator", https://www.qima.com/aql-acceptable-quality-limit. The Acceptable Quality Level (AQL) is a statistical sampling standard defined in ISO 2859 and related quality control frameworks, specifying the maximum percentage of defective items considered acceptable in a random sample during inspection. Evidence role: definition; source type: institution. Supports: the formal definition and application of Acceptable Quality Level standards. ↩
-
"Acceptable Quality Limit, AQL", https://www.qima.com/aql-acceptable-quality-limit. In ISO 2859 sampling standards, AQL values represent the quality level that is the worst tolerable process average when a continuing series of lots is submitted for acceptance sampling, though the relationship between AQL values and actual defect percentages depends on sample size and lot size. Evidence role: definition; source type: institution. Supports: the interpretation of AQL numerical values in quality inspection. Scope note: AQL interpretation requires understanding of sampling plans and lot acceptance criteria ↩